DG News: July 2026
By Discourse Graphs Team | 2026-08-03
- newsletter
Hello and welcome to the July issue of the Discourse Graphs newsletter! There are no summer doldrums in the discourse graph universe — only hot new plugin releases and cool tips on how to use your graph to surf(ace) knowledge.
Announcing the Obsidian plugin public release
We’re happy to announce that the Discourse Graphs plugin is now public on obsidian.md’s community plugin browser! This means you can now install the plugin directly from the Obsidian community page or from the community plugins browser within the Obsidian app, rather than via BRAT.
Ask the docs: what is a discourse graph?
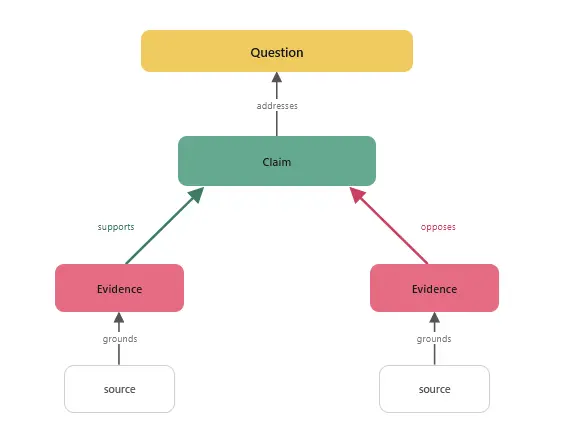
We have a new discourse graph plugin release and a growing community — but what are we all so excited about? Dive into the reason for discourse graph season with this short explainer on the discourse graph protocol, live from our website documentation.
Dispatches from the frontier: a series on how discourse graphs are improving scientific research
We’ve deployed discourse graph tools in labs across cell biology, biophysics, and human-computer interaction — 6+ labs including the OASIS Lab at the University of Maryland, the MATSUlab at the University of Washington, the Holehouse Lab at Washington University School of Medicine, and the Allen Institute for Cell Science — as well as to individual researchers around the world. Here’s what we’ve observed.
Better experiment planning and interpretation
Claim: Discourse graphs surface knowledge artefacts that wouldn’t otherwise exist — candidate results, unpublished measurements, lightbulb moments buried in email chains — informal evidence that never makes it into papers but shapes ongoing work.
Evidence: A PhD biophysics researcher at McGill University used a map of questions, claims, and evidence — drawn from both literature and his own experiments — to reason about which experiments to conduct next, using their discourse graph to discover which hypotheses are well-supported and which are “baseless conspiracy theories” requiring further experiments (h/t Sean Moore).
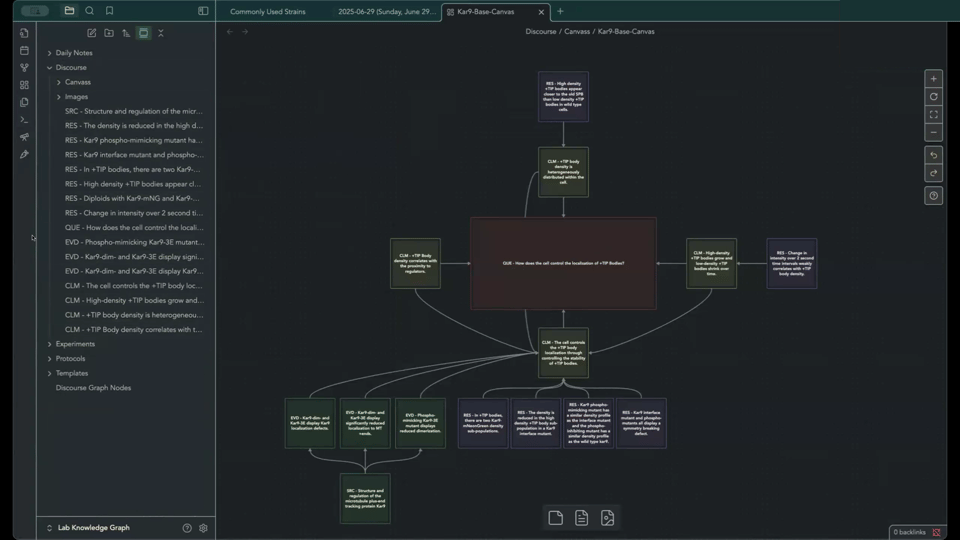
Evidence: A cell biology researcher at the University of Washington referred to a specific piece of evidence (not a paper, not a claim) to argue for a faster timescale in their lab’s osmotic shock experiments, adapting and improving their experimental design in real time.
Evidence: Researchers in the MatsuLab drew on informal evidence sourced from correspondence to interpret a new result, used results published internally in the lab graph to ground a new measurement, and referenced evidence and source nodes from the shared lab knowledge base created months to years prior to scope out a new project.
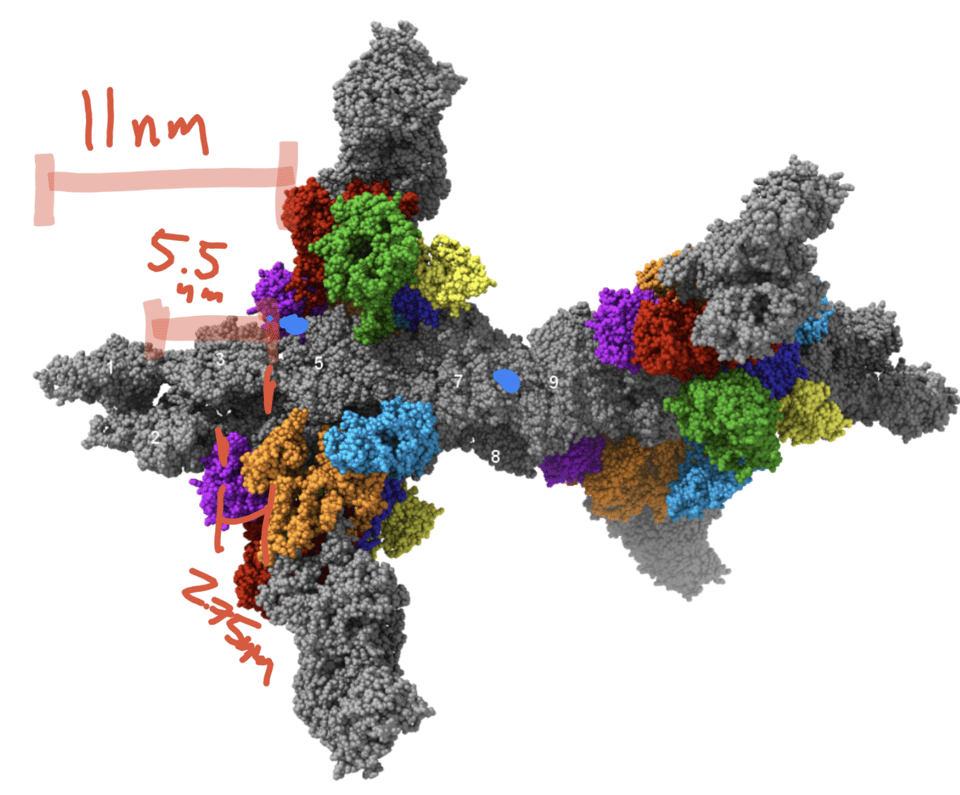
No piece of evidence is too small — or too unpublished — to spark a lightbulb moment.
Claim: The granularity of discourse graphs and their friendliness to incorporating informal sources of knowledge make this kind of reasoning possible.
Tune in next month when we explore how our pilot users are using discourse graphs to support better synthesis of their works-in-progress!
We’d love to hear from you about how you’ve been using discourse graphs to accelerate your research. Please contact us via email to share your experiences!
Contributions
- If you’re interested in contributing to the project, please read our guide on Github for how to do so.
- We are also open to sponsors, collaborators, and grant opportunities. Please contact us via email regarding any of those.
Thanks for reading and joining us on this journey to make science and research easier and more accessible for everyone. Until next time!