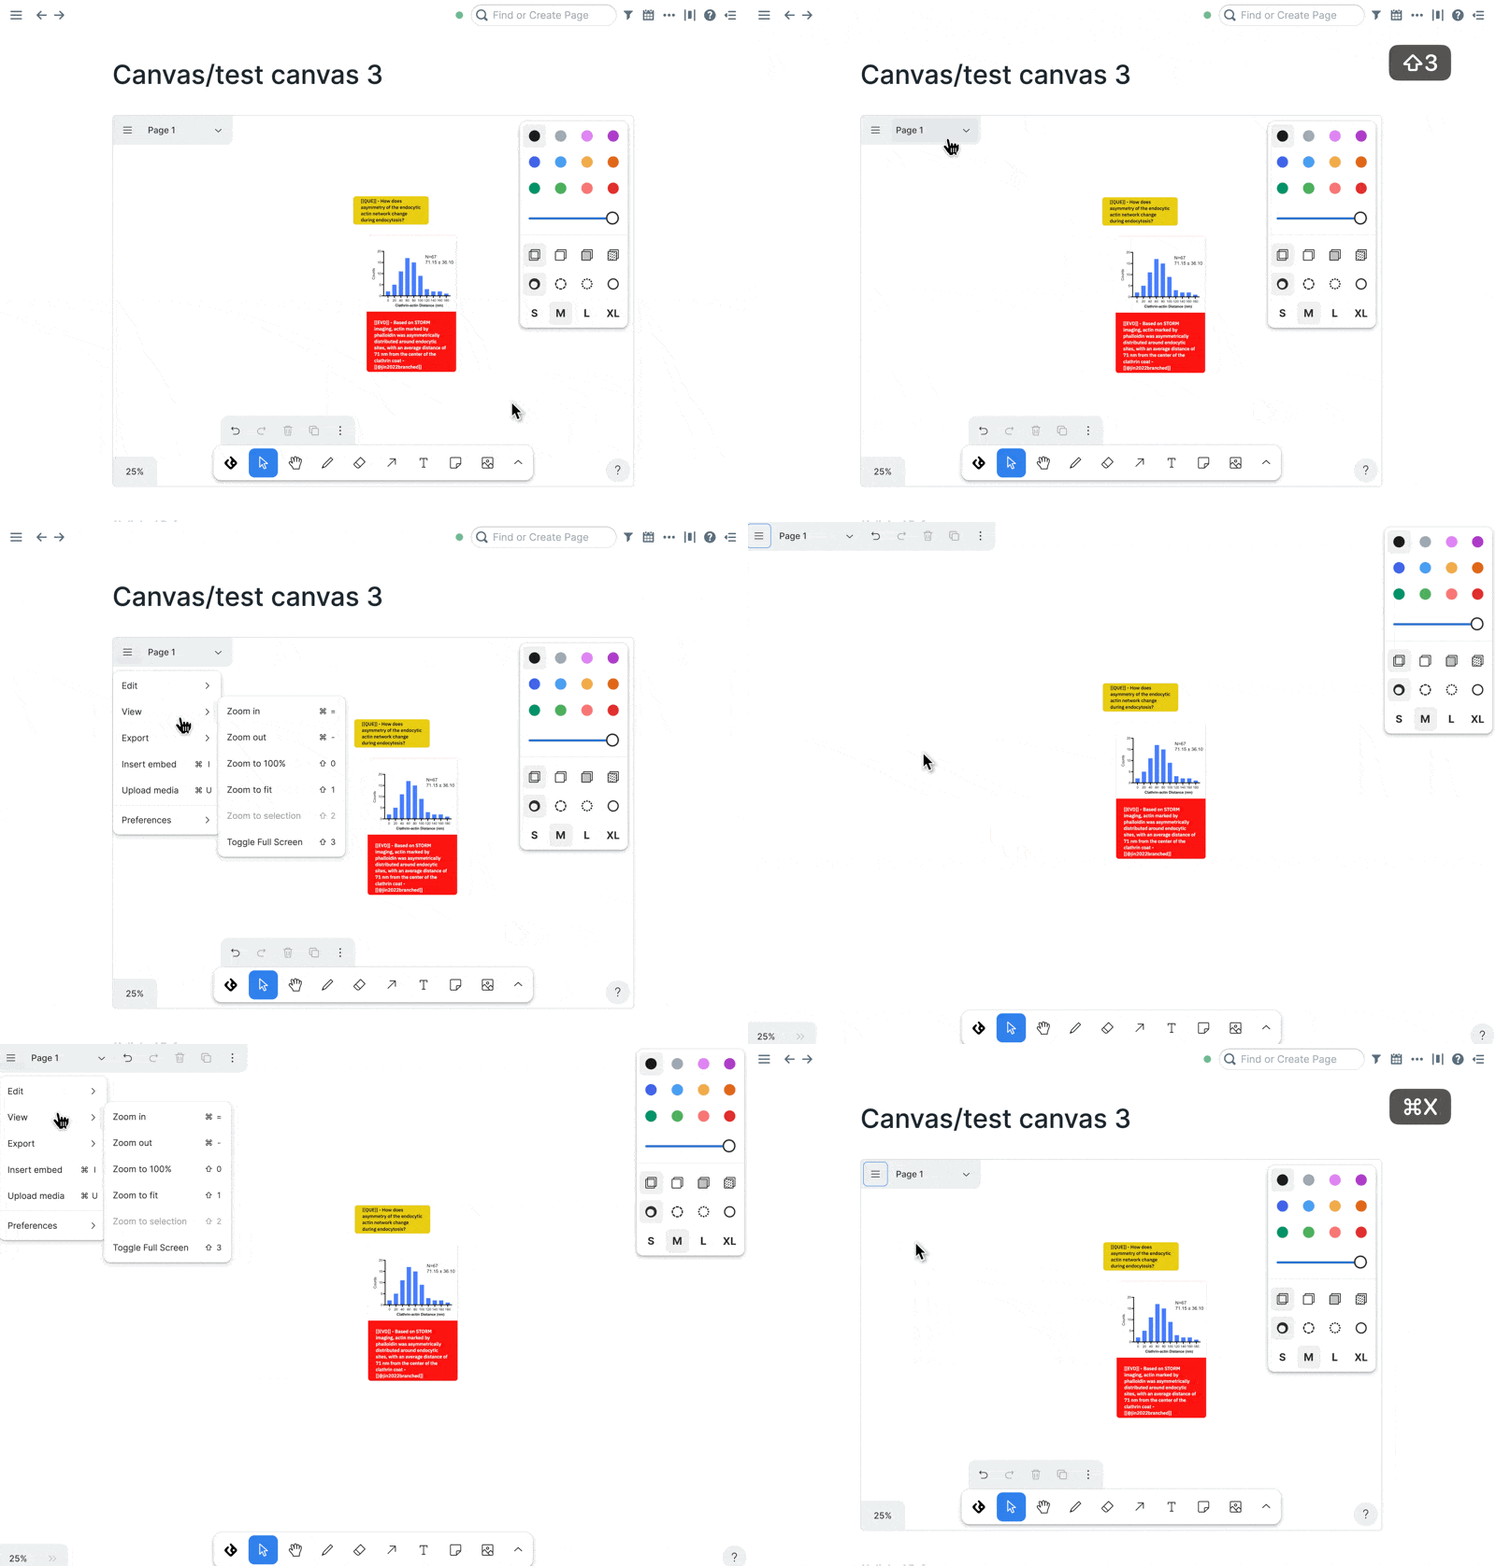
Using the canvas
The Canvas lets you lay out your work visually. It’s great for synthesizing your work into a story: you can arrange nodes you’ve already created into a canvas layout, or generate new nodes directly from the canvas itself.
Creating a canvas
You can create a discourse canvas by creating a new Page titled “Canvas/(canvas name)”. The plugin will recognize Canvas/ and automatically create a canvas page.

Creating a canvas using the page title convention
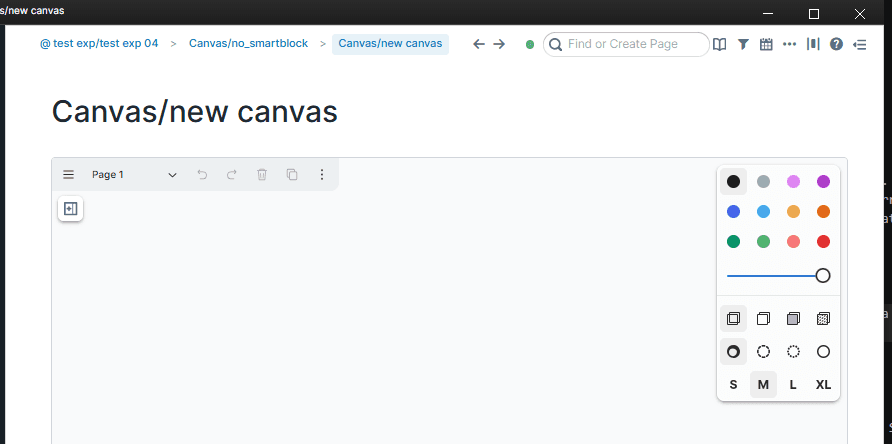
The newly created canvas page
The following is a brief digression on using SmartBlocks to automate canvas creation.
You can automate canvas creation using the SmartBlocks extension.
- Install SmartBlocks from Roam Depot
- Create a page called “Templates” and paste this block onto that page.
- Point the “New Canvas” link highlighted in yellow (below) to the “New Canvas” form by right-clicking on the bullet highlighted in yellow > copy block ref > paste after
%FORM: - Type
jjfollowed bycanvasanywhere in your graph to create and title a canvas. The canvas will then be created as a new page in your graph. You can also copy the button text highlighted in magenta below to any page in your graph to create a button enabling one-press canvas creation.
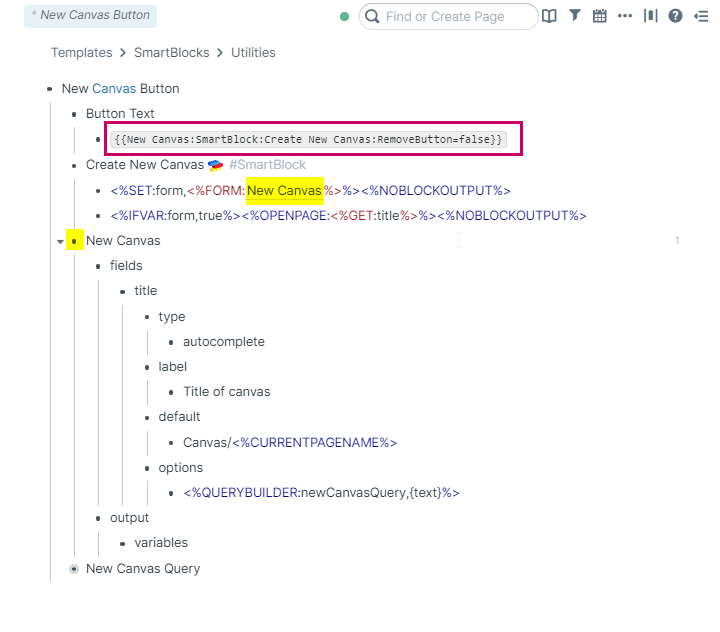
The “Create Canvas” SmartBlock
Now back to our regularly-scheduled content about using the canvas. You can re-use the pattern above to mine the template graph for SmartBlocks to use in your discourse graph.
Adding nodes to your canvas
Add nodes to your canvas by selecting the discourse graph symbol on the taskbar at the bottom of the canvas pane. This opens the node selection menu — select a node type, then click on your canvas to place the node.
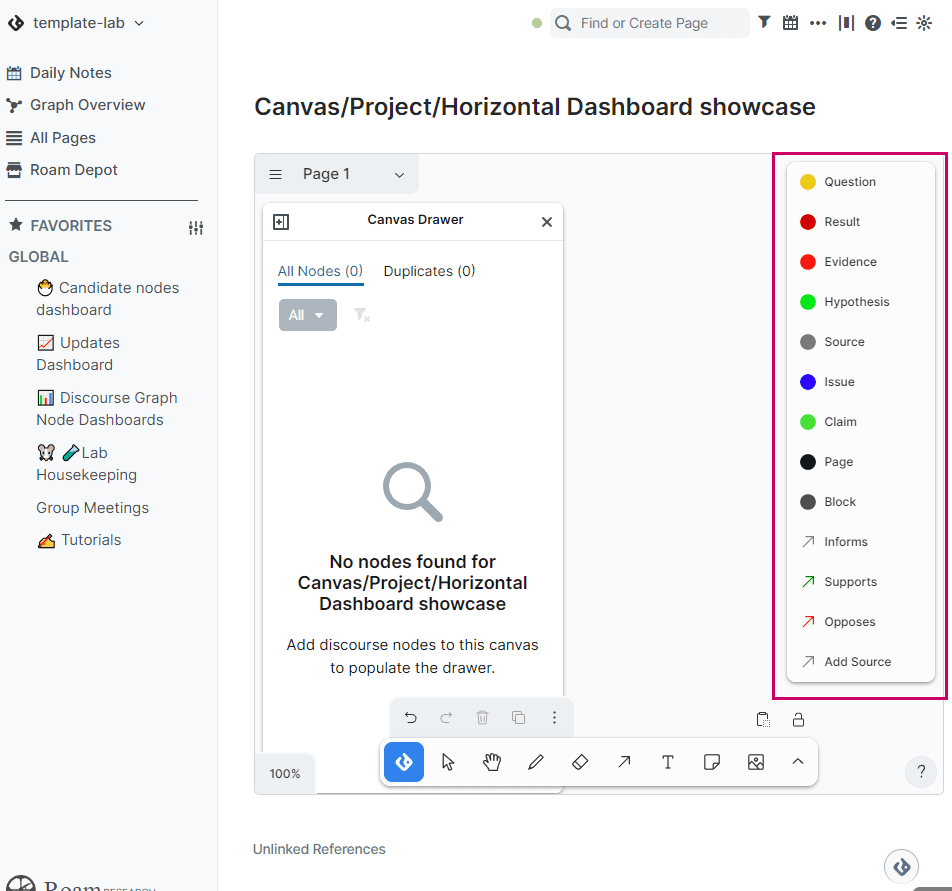
Open the node selection menu by clicking on the discourse graph symbol in the lower toolbar
Placing a node on your canvas opens the node title menu. As you type the name of the node, the form autocompletes with the names of nodes already in your graph. You can select one of these existing nodes or create a new one.
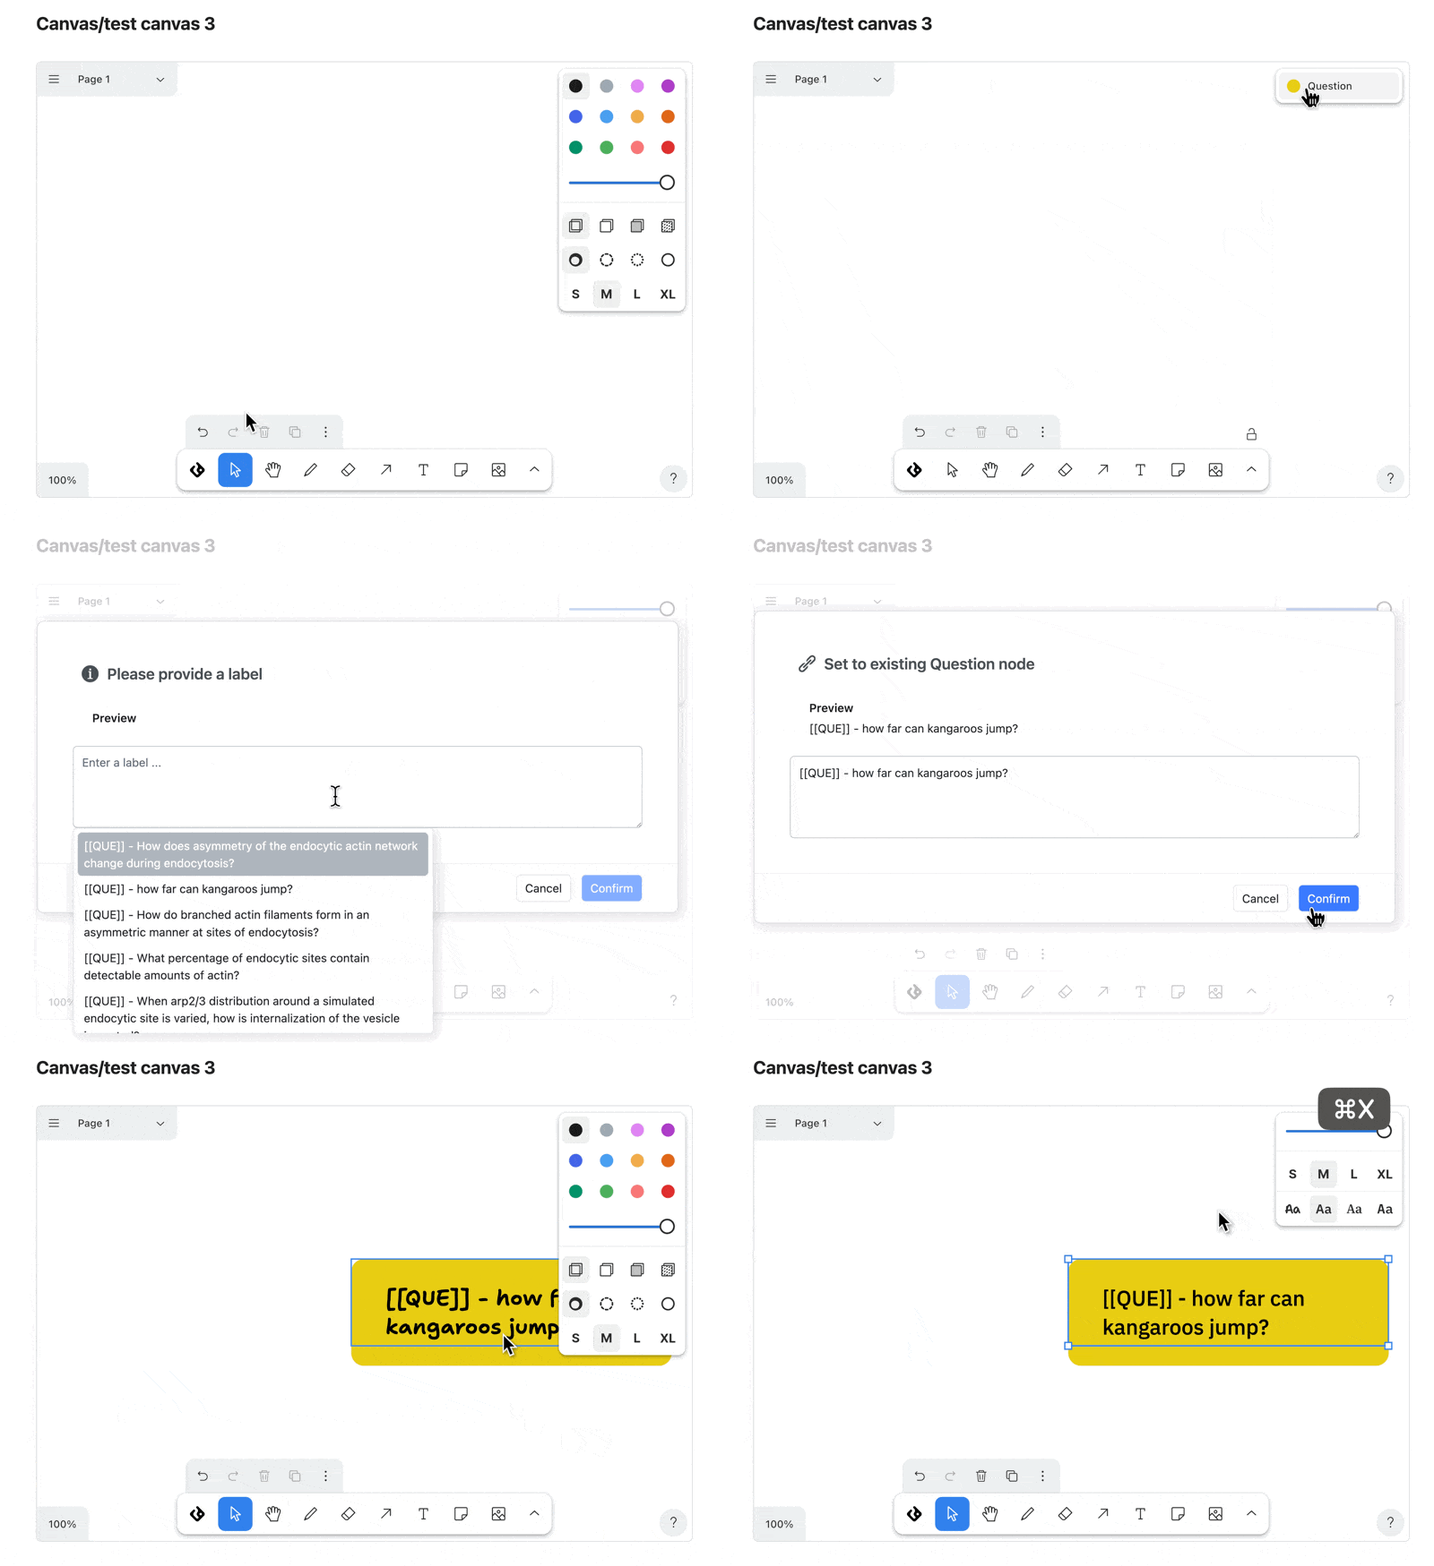
Selecting nodes to add to your graph
Connecting discourse nodes with relations
You can make the connections between your discourse nodes more informative and explicit by adding relations. For example, an Evidence node might Inform a Question node, or Support a Claim.
To create a relation, click the discourse graph symbol in the lower toolbar and select the appropriate relation arrow, then drag the arrow between nodes.
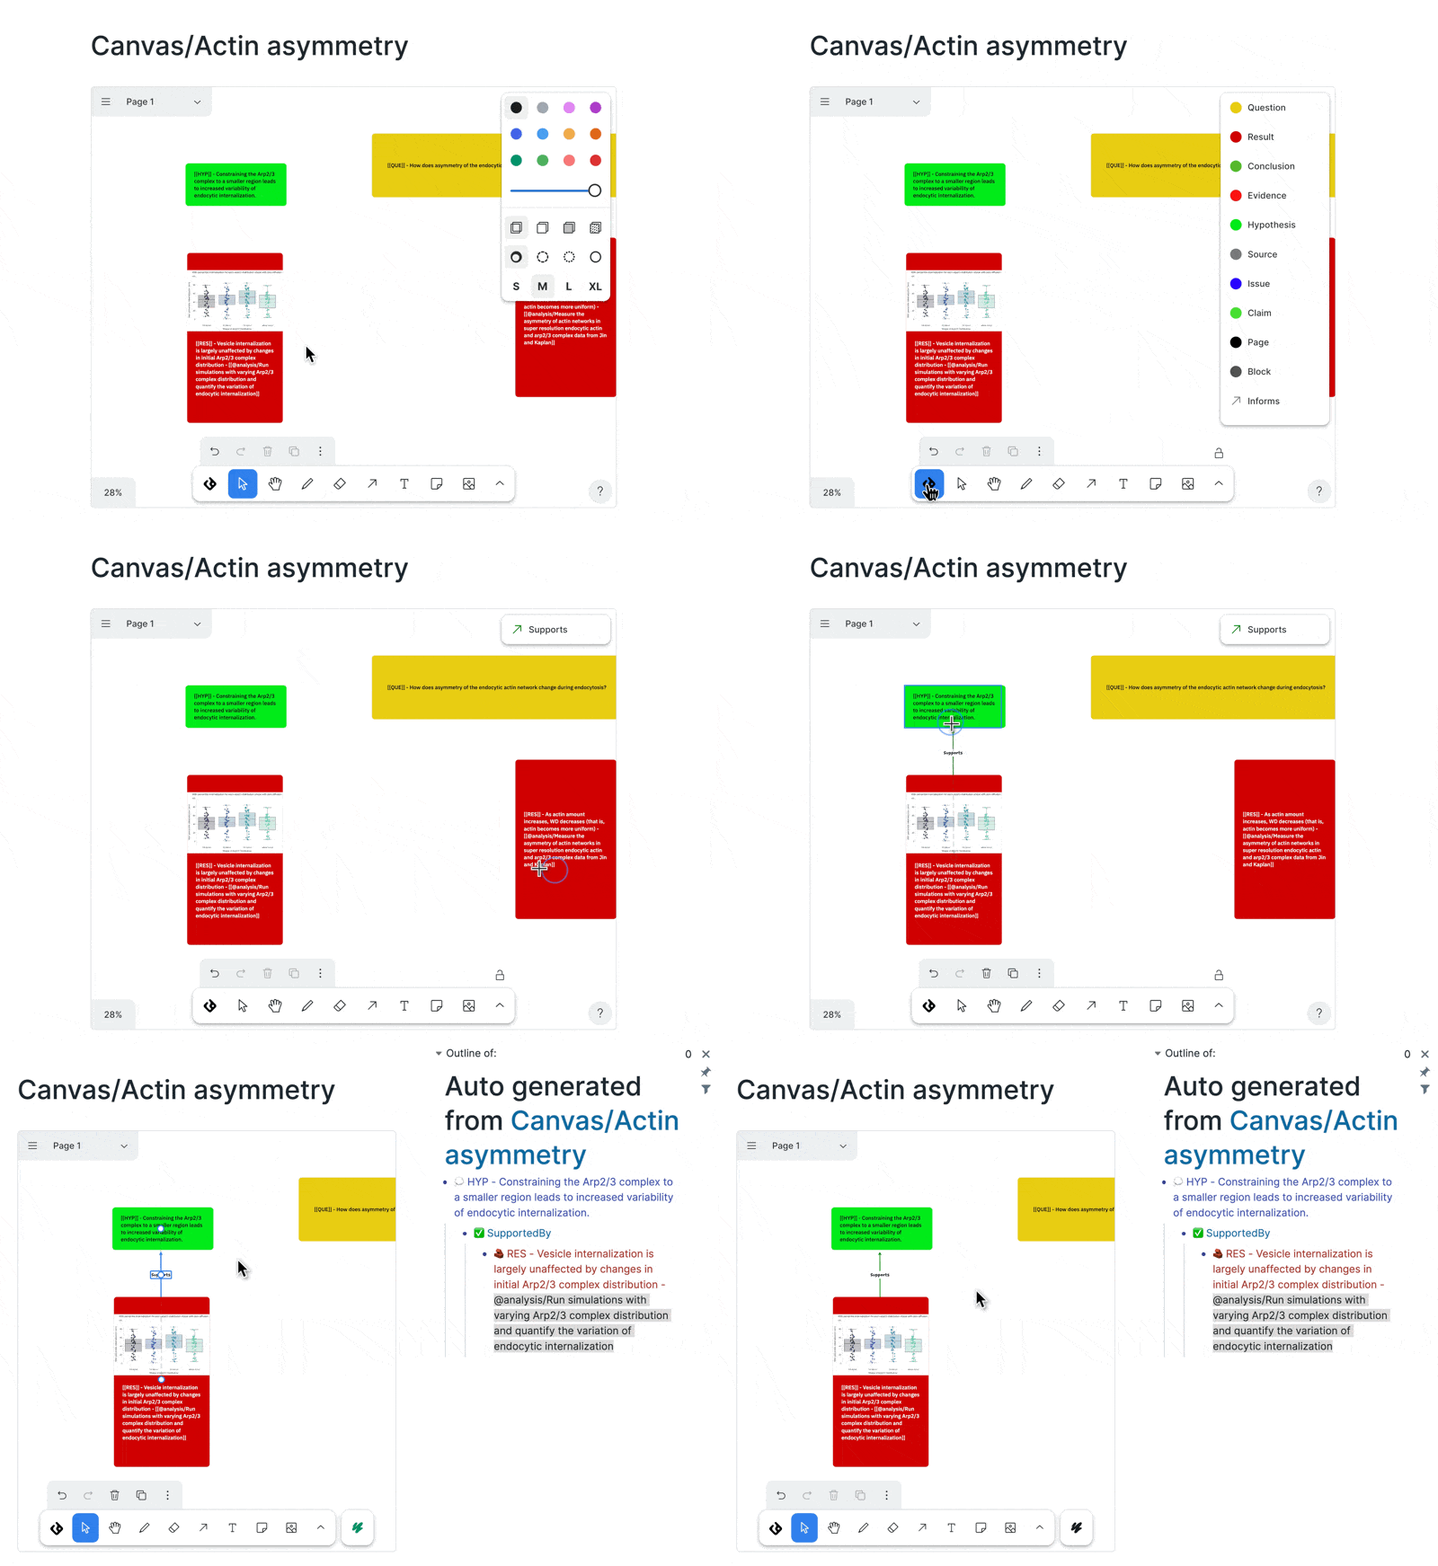
Using the relation menu
You can also create a relation on your canvas by clicking on the origin node until the grey drag handles appear and dragging the relation arrow to the target node. You will be prompted to select from one of the available relation types for those nodes.
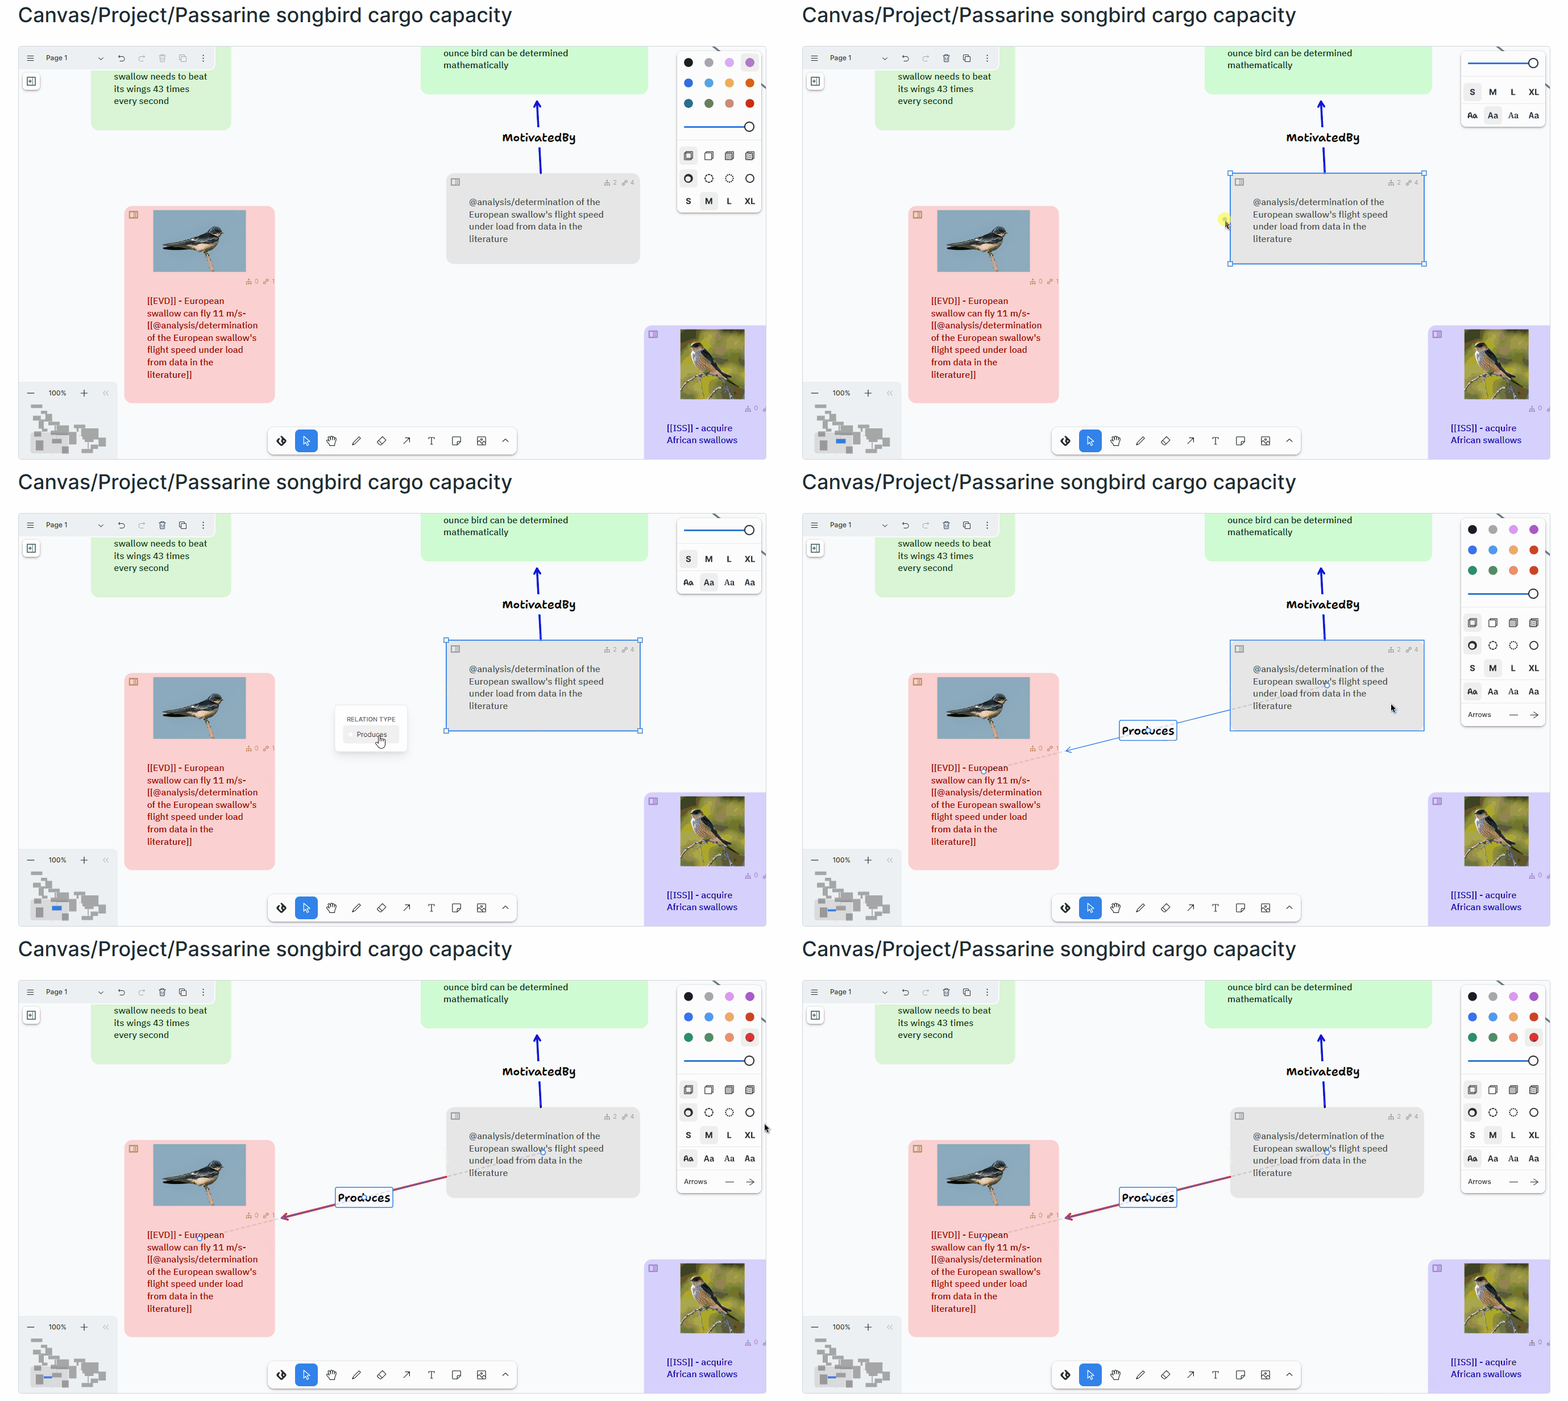
Creating a relation using the node drag handles
Additional node and relation types can be defined in the Settings menu.
Managing canvas content
The canvas drawer
As you add nodes to your canvas, they’re also added to the Canvas Drawer. Use this drawer to jump straight to a particular node on your canvas by clicking the target icon next to its title — a feature that becomes more useful as your canvas gets busier. The canvas Drawer also highlights any duplicate nodes in your canvas.
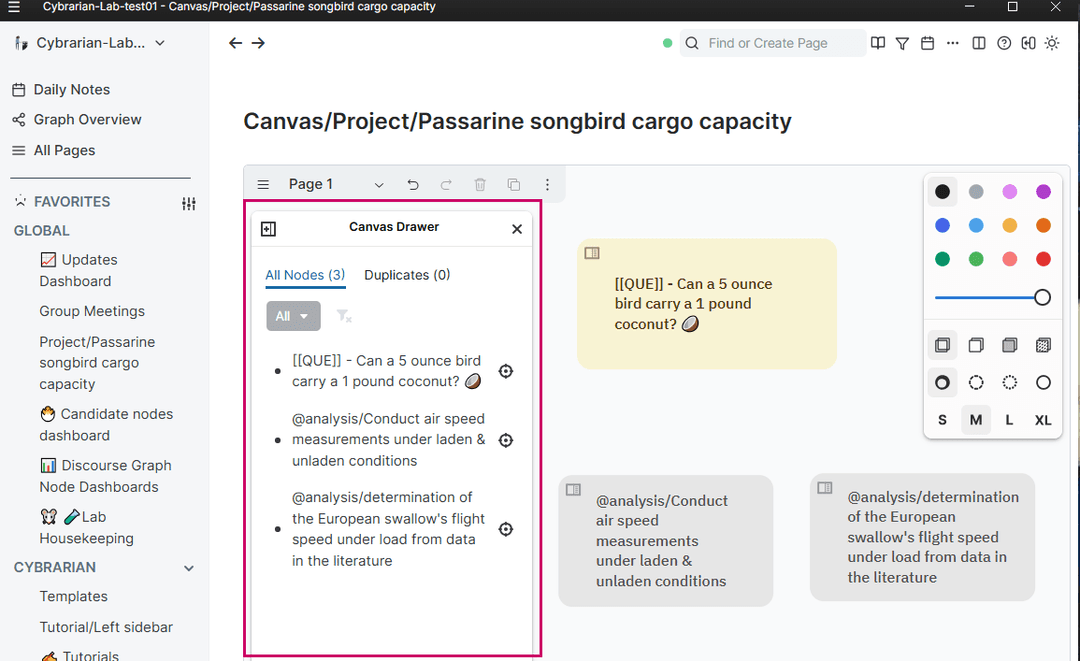
Rummaging through the canvas drawer
The clipboard
Use the Clipboard to keep track of what’s on the canvas and what should be on the canvas. It allows speedy bulk importation of all the nodes from a particular page or set of pages.
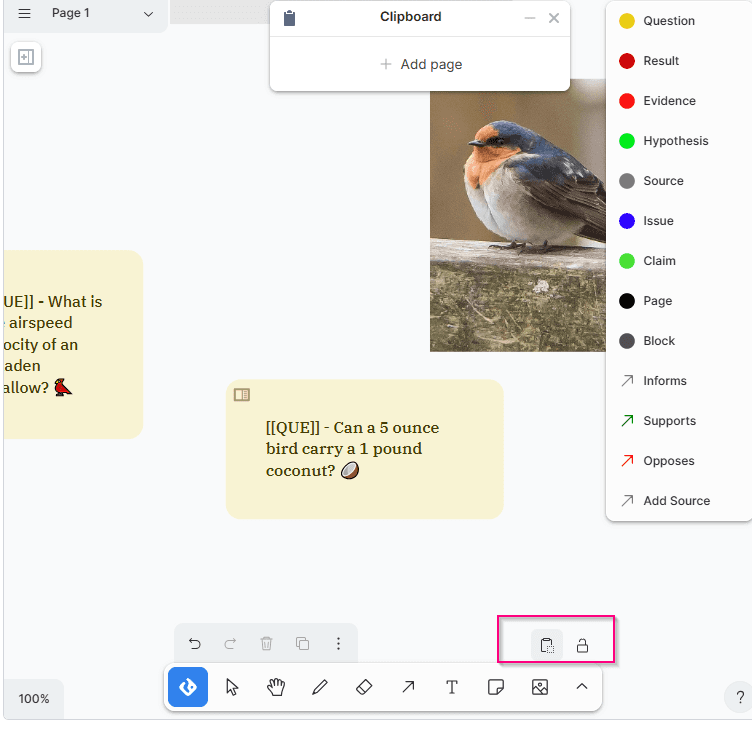
The clipboard icon
Open the Clipboard by clicking the discourse graph icon in the bottom toolbar, which causes the Clipboard icon to appear. You can use the Clipboard to search for pages with content relevant to your canvas.
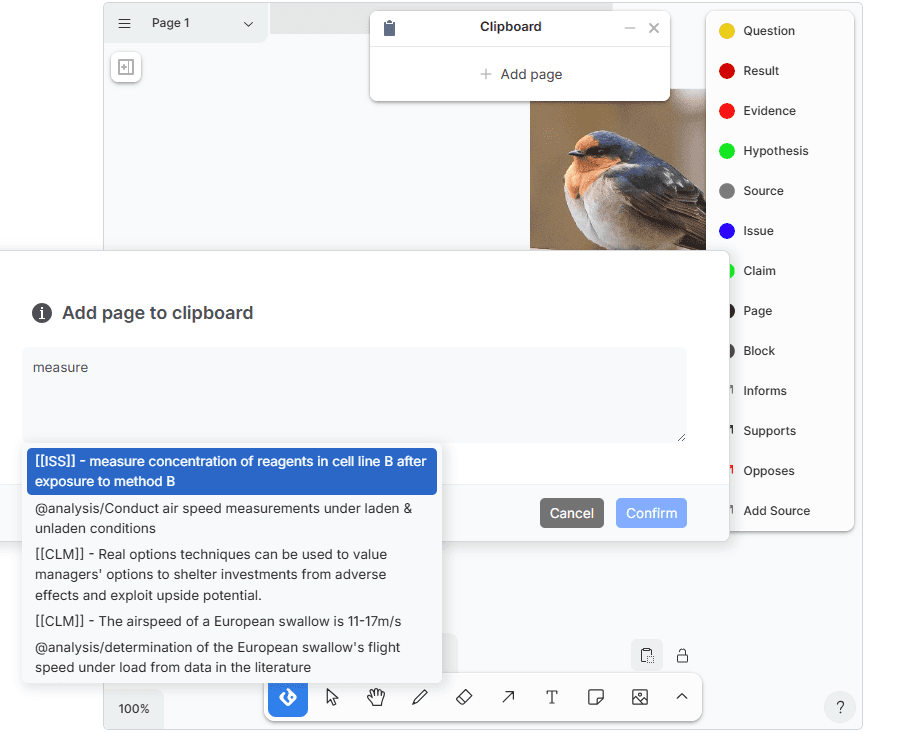
Searching for pages to add to the clipboard
All the discourse nodes found on pages you import to your Clipboard are listed as options to add to your canvas. If a node in the Clipboard is already on the canvas, clicking it navigates to that node.
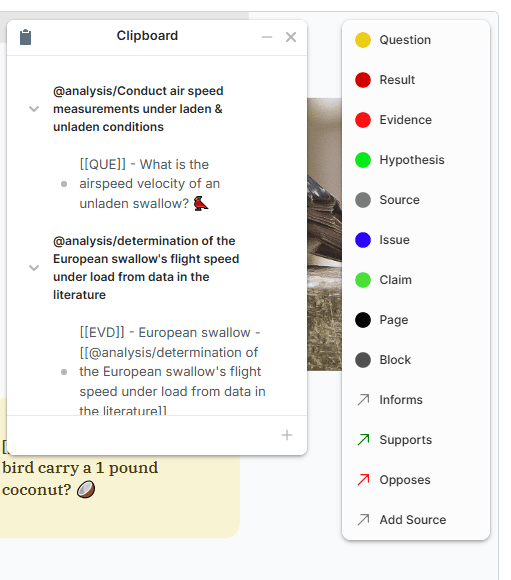
Viewing clipboard content
You can drag nodes not already on your canvas onto your canvas from the Clipboard.
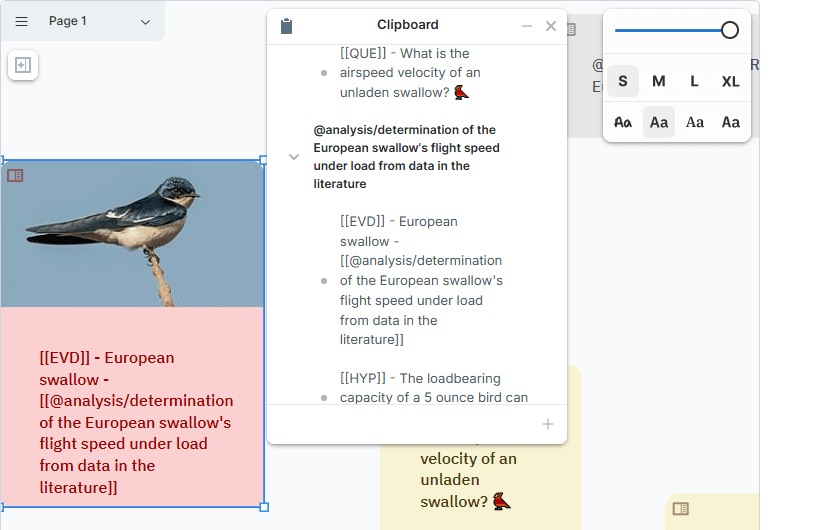
Dragging nodes from the clipboard
Using key images
If you enable the Key Image setting in the Discourse Graph Settings menu for a particular node type, any nodes you add to your graph will bring along the first image from that page.
If you wish to draw your key images from a consistent location in your node template, you can create a query targeting all such images and enter its block reference (right-click the bullet next to the query and select “Copy block ref”) in the “Query builder reference” field in that node type’s canvas settings.
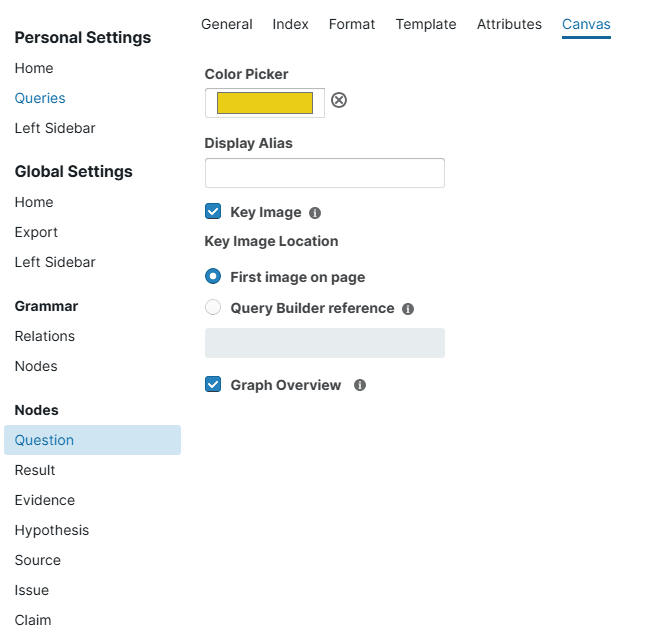
The key image settings for the Question node type, found in discourse graph plugin settings > nodes > Question > Canvas tab
For example, the image below shows a query that draws the first image found under the heading “Figures & additional characterization.” The block reference for this query has been set for the Evidence node type.
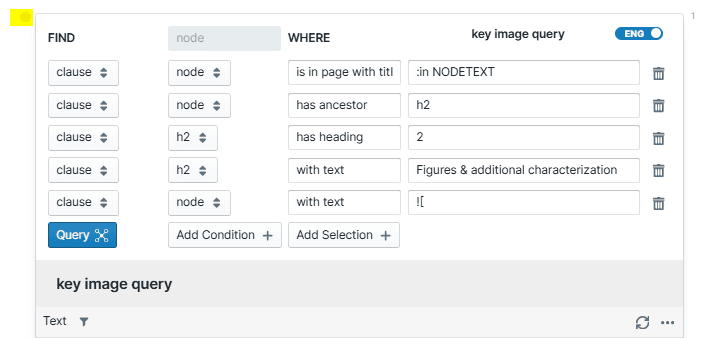
A key image query. Its block reference can be found by right-clicking on the bullet highlighted in yellow
Whenever an evidence node is added to a canvas, it brings along the first image under that heading, rather than the first image on the page.
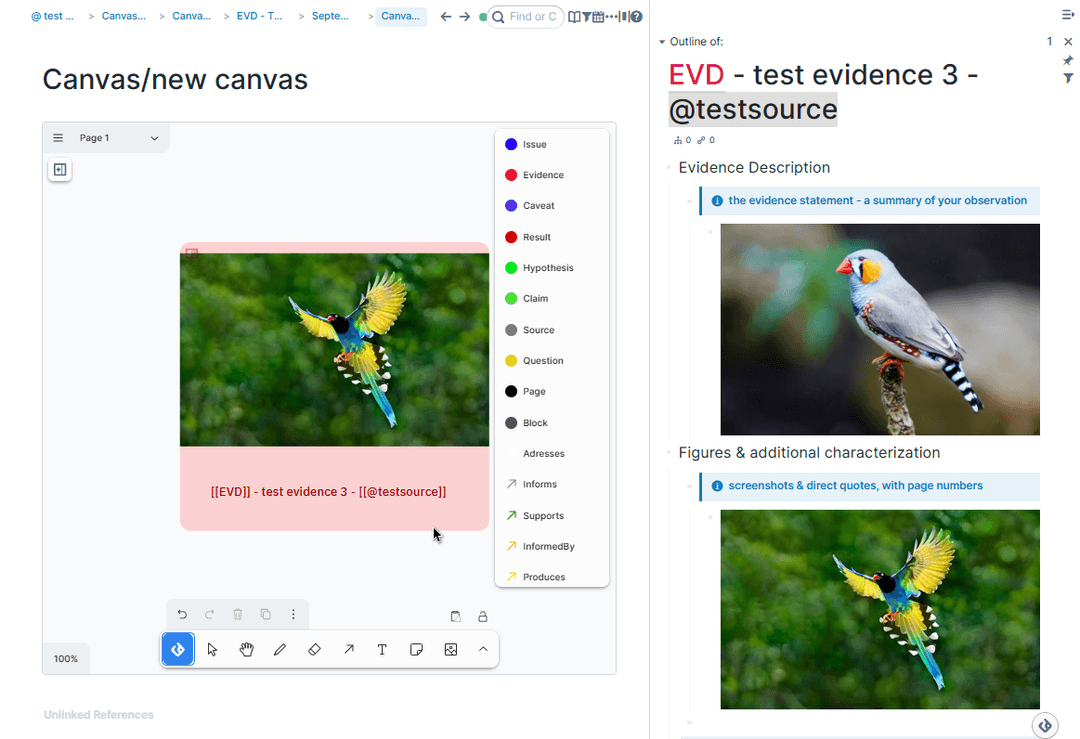
The key image on the canvas
The sidebar
Clicking the sidebar icon on any node opens that node’s page in your sidebar.
The sidebar icon
You can use this side-by-side view to examine a node’s content without losing sight of your canvas, and to easily copy and paste additional material from node pages to your canvas.
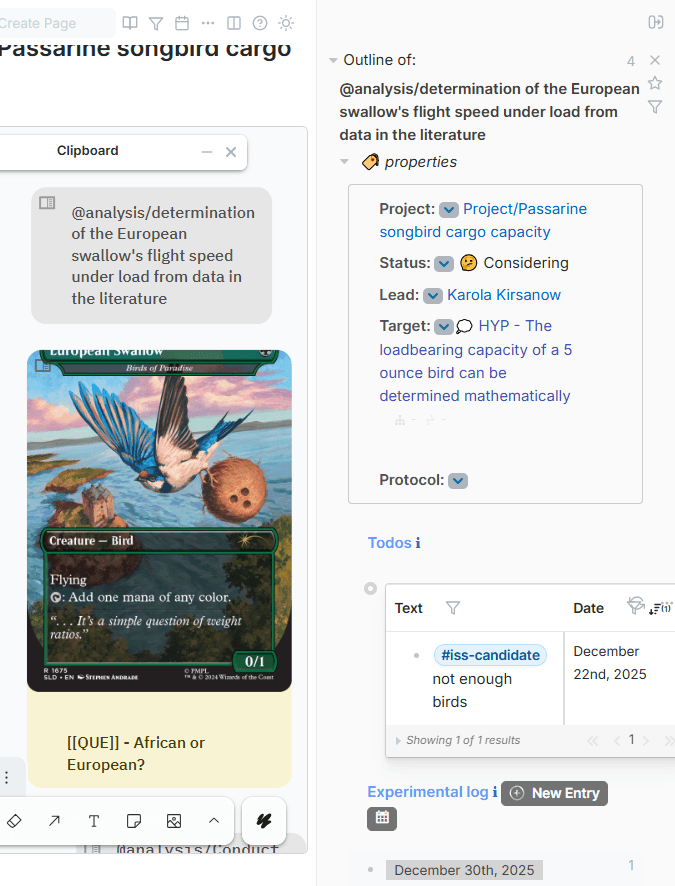
Viewing sidebar content next to your canvas
Sending query results to the canvas
To export multiple results from a query run in your graph to a canvas, open the query table menu and select Share Data → Send to Page, then either select an existing canvas or create a new one to receive the results.
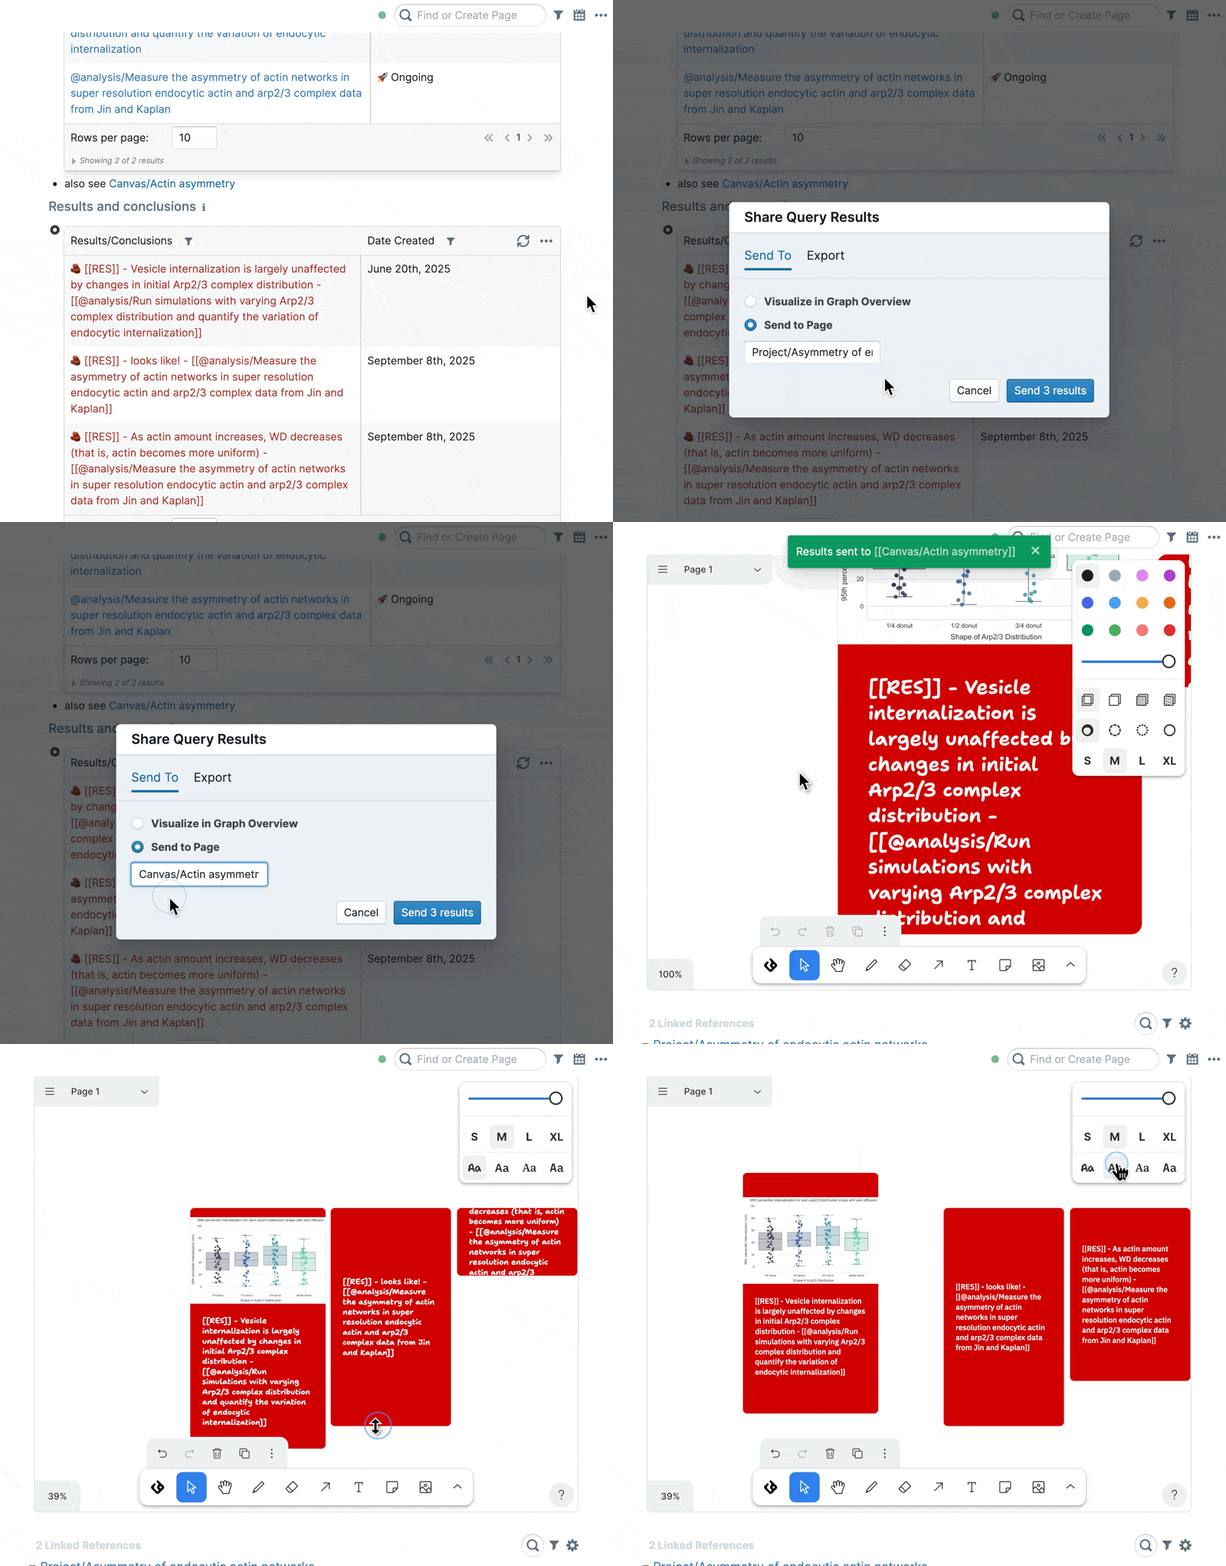
sending query results to your canvas
Converting images or text into discourse nodes
You can select images or text from your graph, a document, a file, or a webpage, copy them to your canvas, and convert them into discourse nodes.
To convert an image, hover over it and click the convert icon that appears in its top-right corner. In the create node dialog, pick the node type, enter a title, and confirm. The image is replaced on the canvas by the new node and, if Key Image is enabled for that node type, added to the node’s page.
You can also right-click an image or text shape and select Convert To, pick the node type, then modify the title as needed. Use this path to convert text shapes or to turn an image into a block.
Remember to enable the Key Image feature in Settings if you want to convert images to discourse nodes.
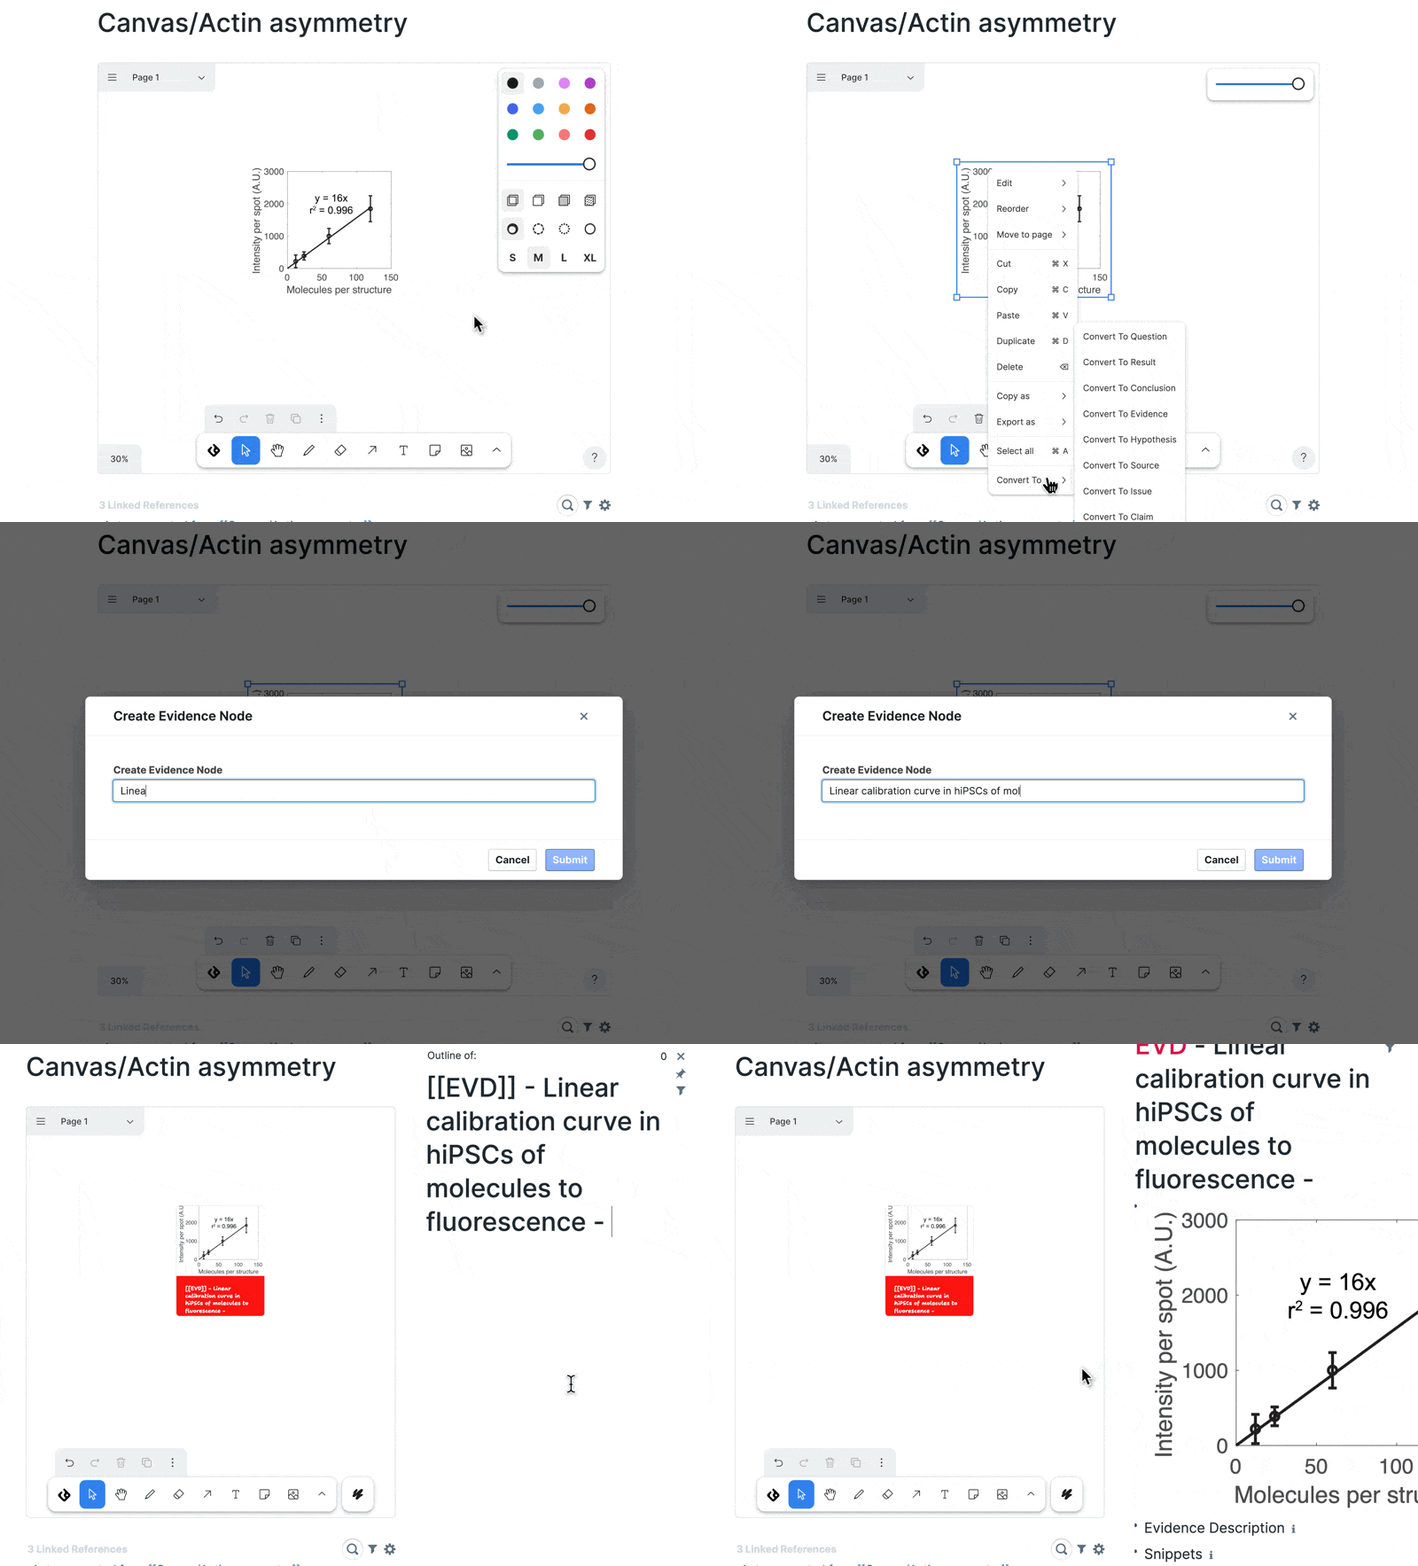
Converting an image to an evidence node
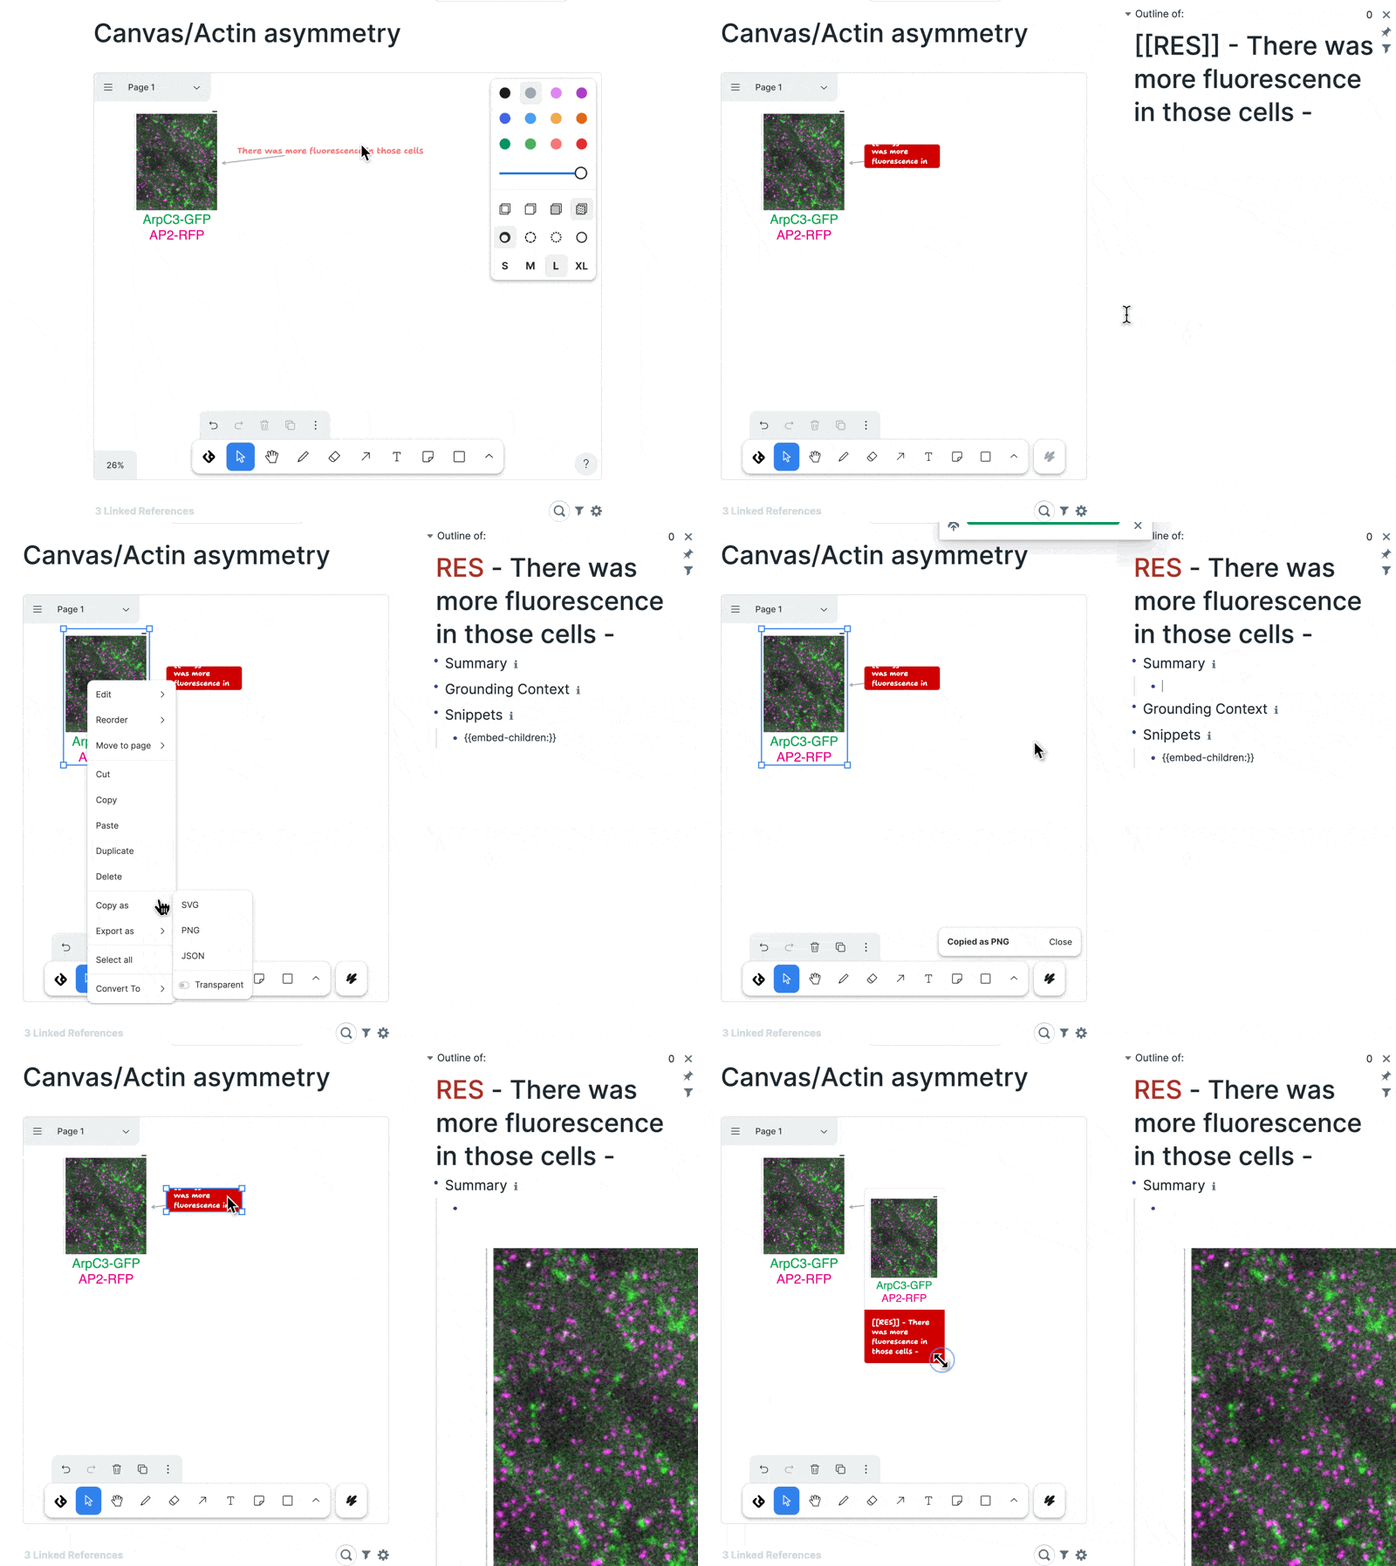
Converting text to a result node
Synchronizing your canvas and graph
Nodes created on the canvas are added to your graph. Edits made to node titles on your canvas are propagated to your graph — this can take a few moments, or until your next page refresh.
Double-click a node on your canvas to refresh it immediately.
Edits made to node titles in your graph may not propagate to your canvas until you refresh the page
Annotating your canvas
The canvas has additional features to help with visual sensemaking of your discourse graph. You can use freehand drawing tools to annotate images or the canvas itself, and add text boxes and shapes for additional context around discourse nodes and relations.
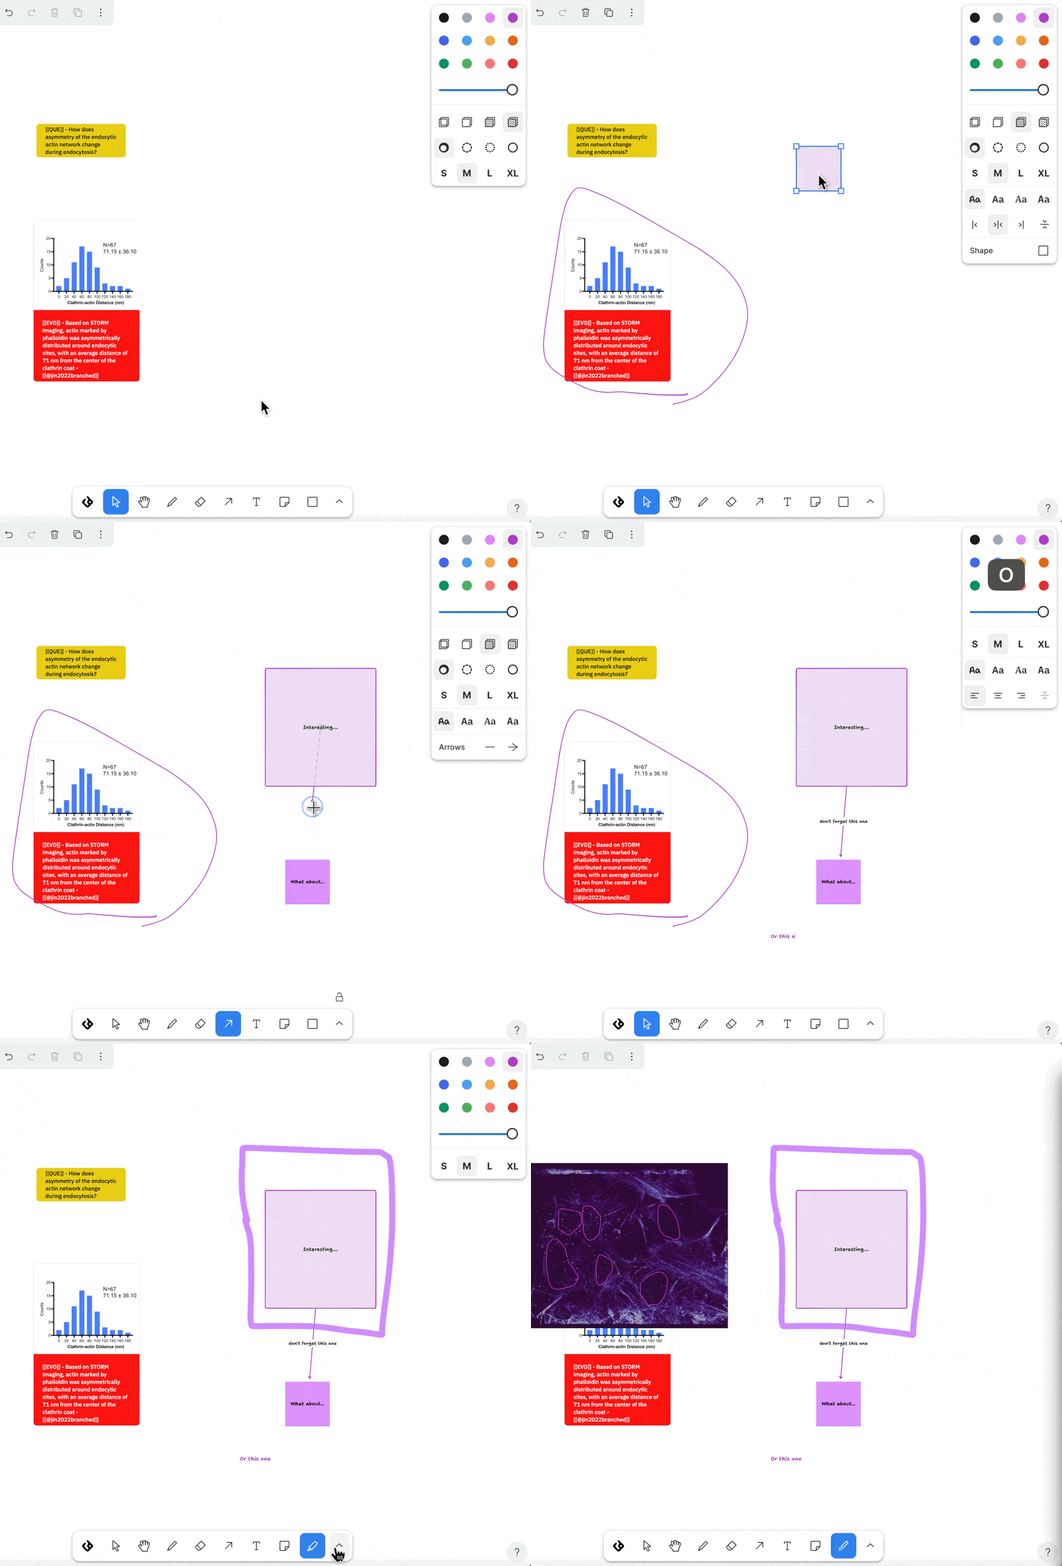
Adding text boxes and shapes to a canvas
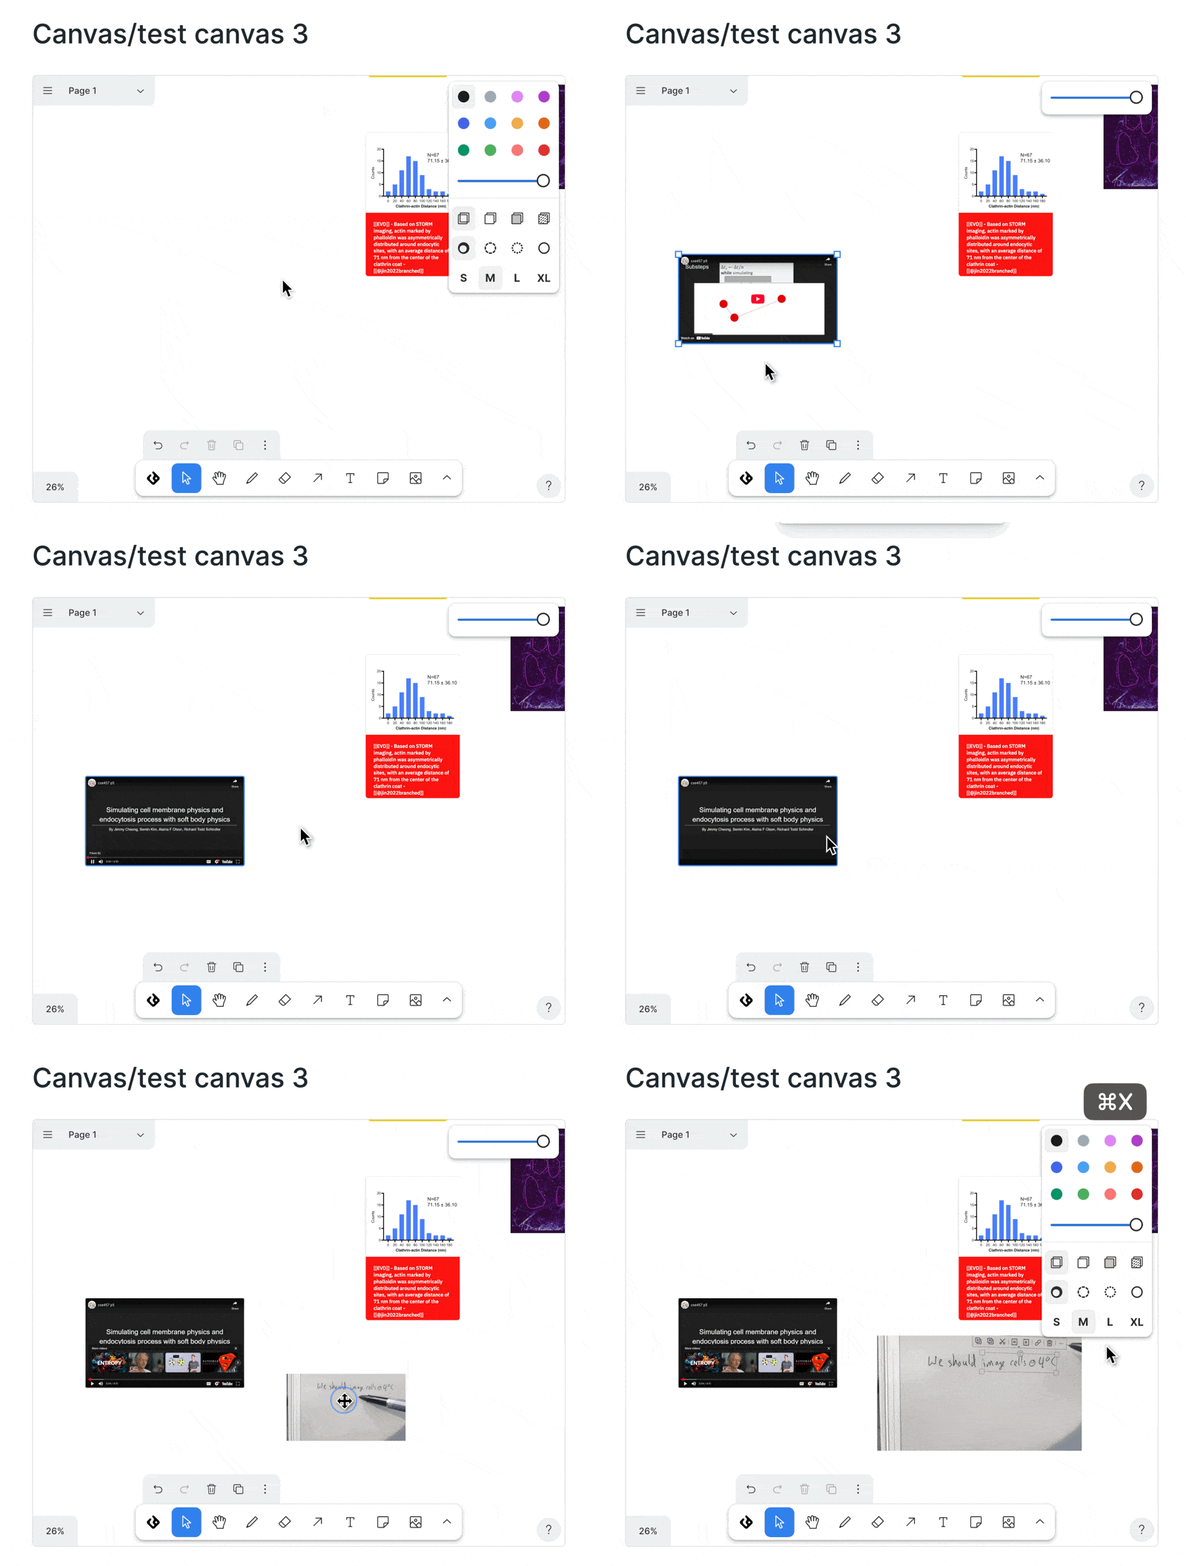
Adding video to a canvas
Stickers, arrows, GIFs, YouTube videos — anything that enhances understanding or presentation. These features can come in handy during a live or recorded canvas walkthrough.
Co-working on your canvas
The discourse canvas supports simultaneous read/write operations from multiple users of your graph. Enable the Cloud Canvas setting to synchronize your view of the canvas to use it as a shared real-time whiteboard.
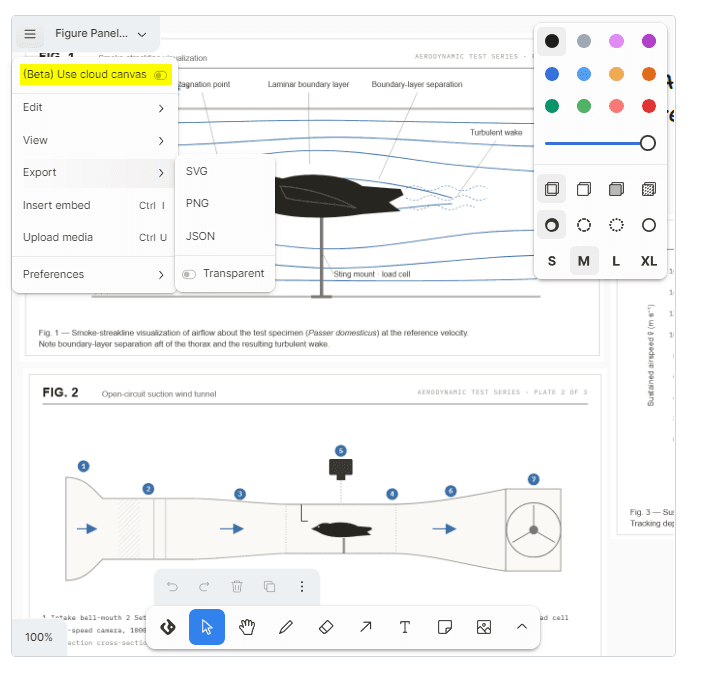
The cloud canvas setting
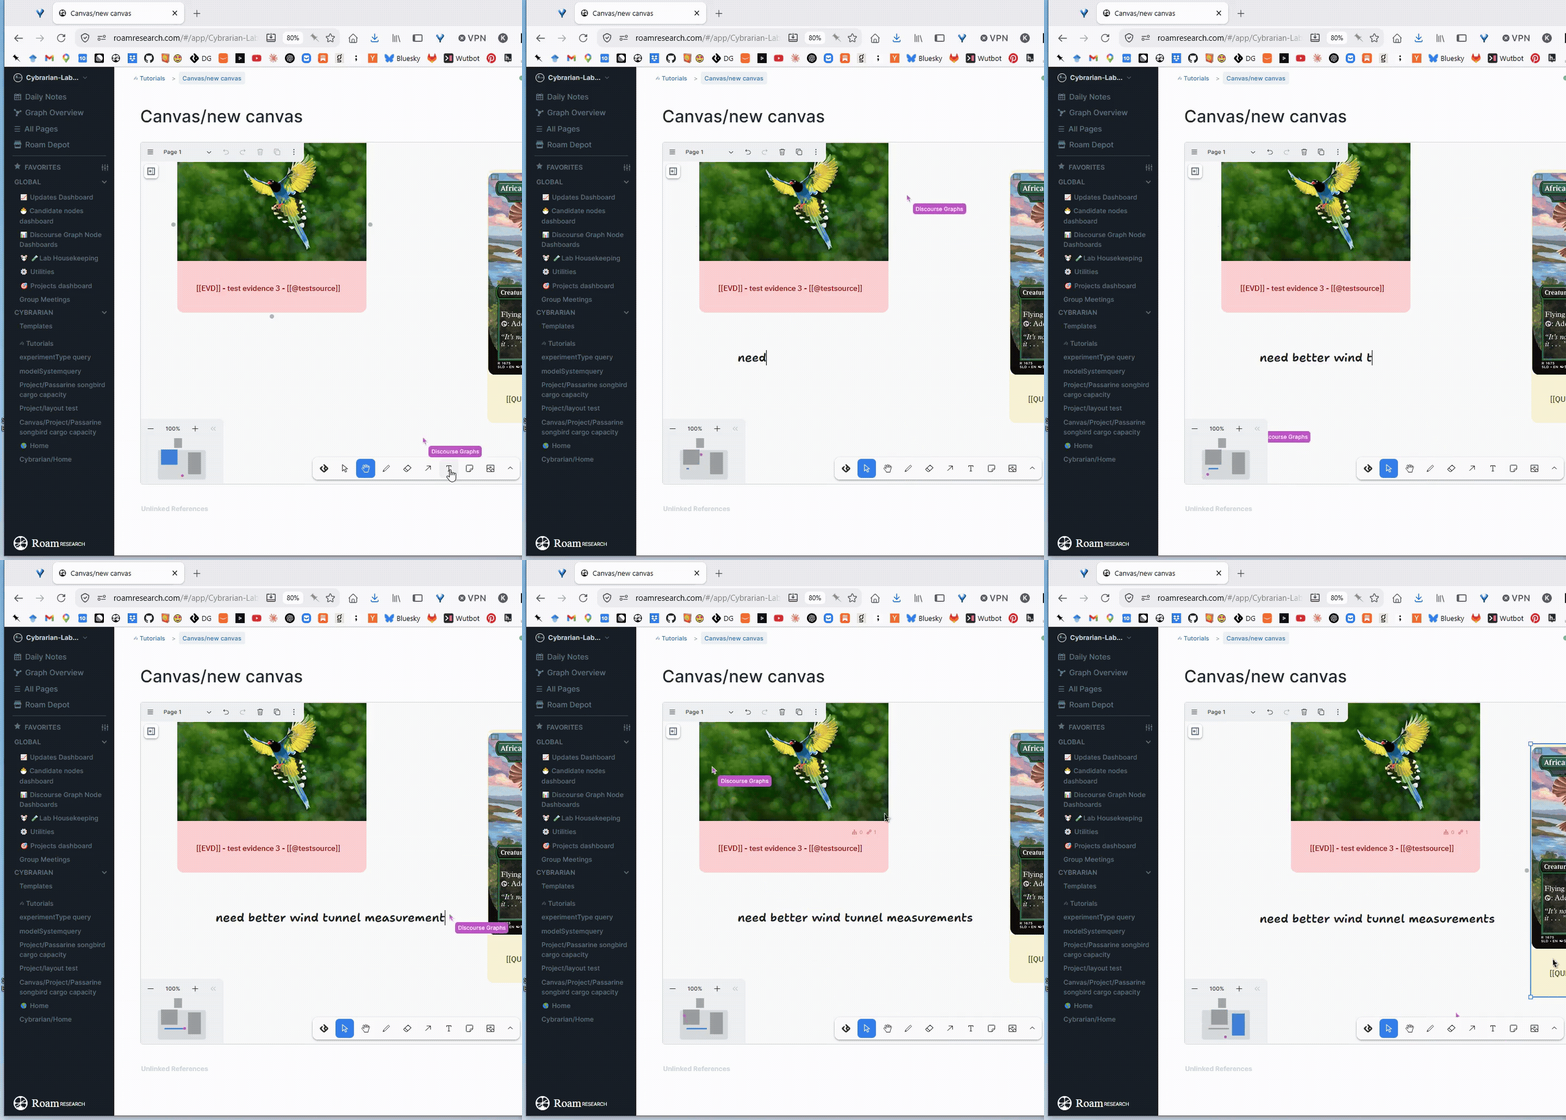
Collaborating on a cloud canvas
Exporting your canvas
The canvas can be exported as an SVG, PNG, or JSON by right-clicking the canvas, or from the menu in the top-left corner via Export. You can also selectively copy and export specific canvas elements.
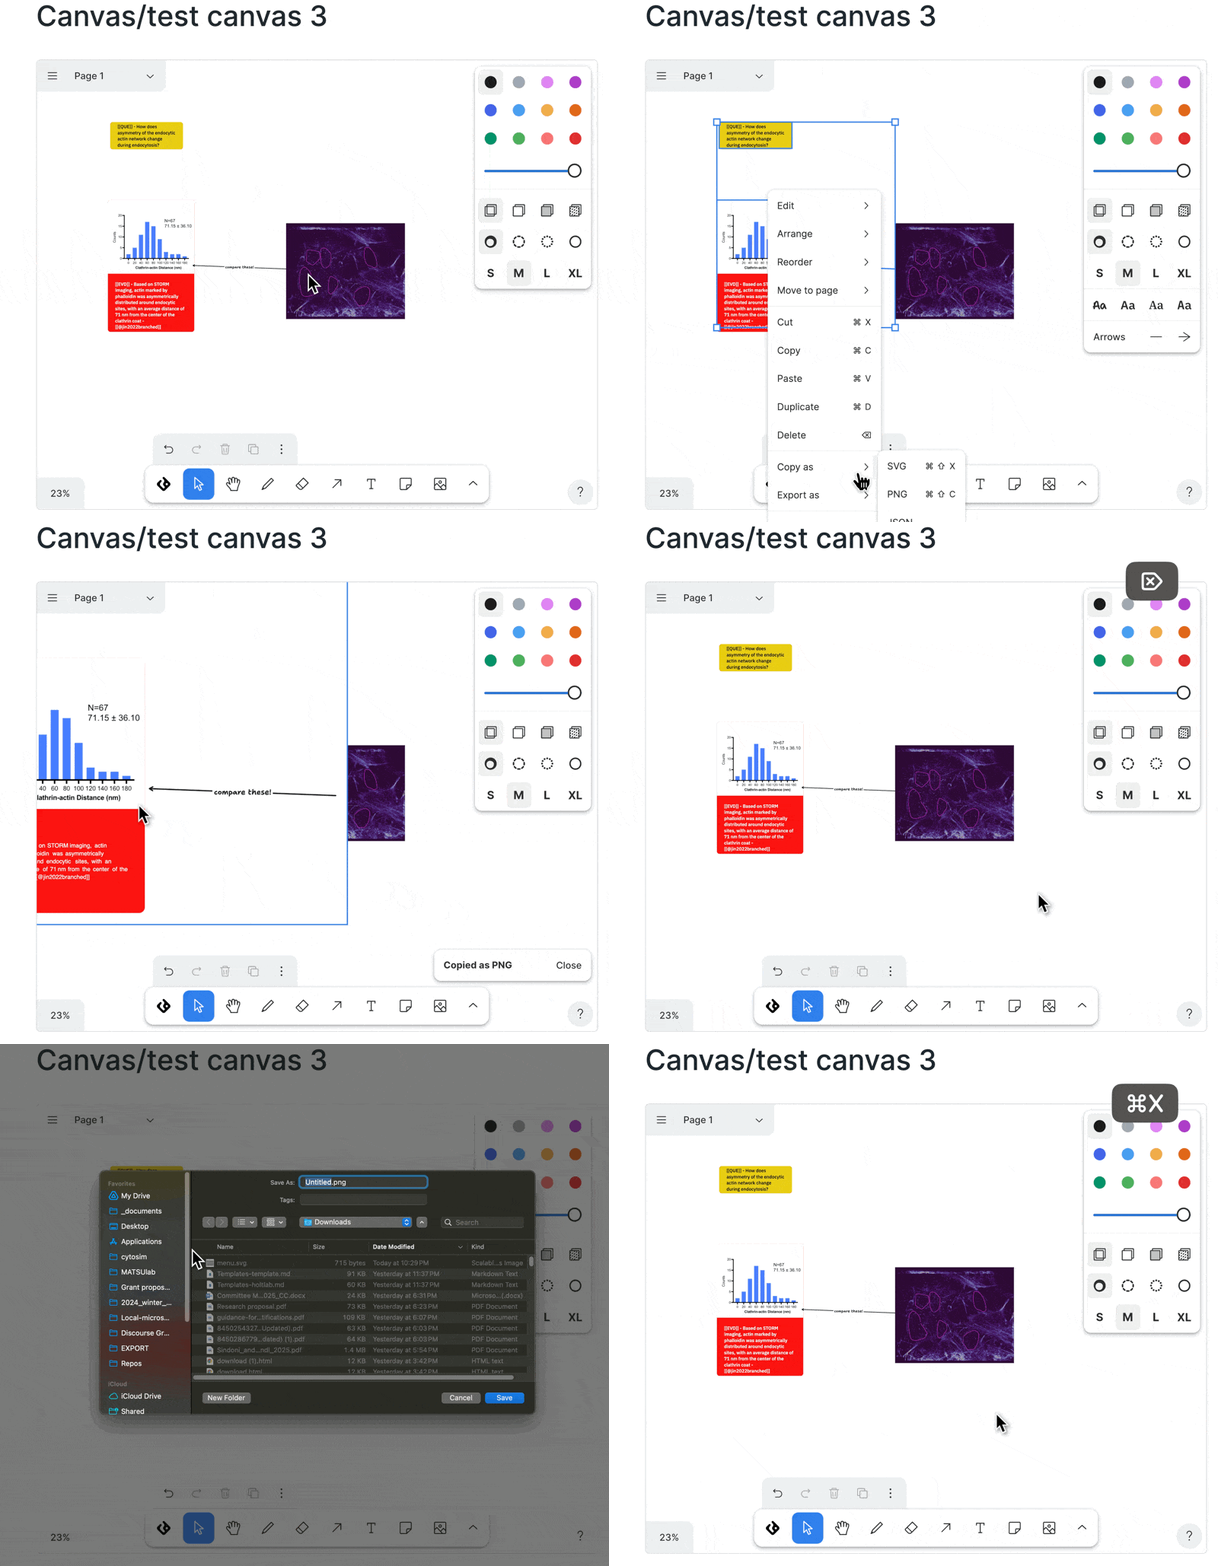
Choosing a format for canvas export
Viewing your canvas in full-screen mode
Type Shift + 3, or click the menu icon → View → “Toggle Full Screen”.